What the raw gyro variation follows
Across all 53 selected stretches, the raw pitch-axis rates lie closer to the globe-plus-specified-field prediction than to either simpler prediction on the median-difference measure below. No gyro offset, gain, attitude or field magnitude was fitted for this comparison.
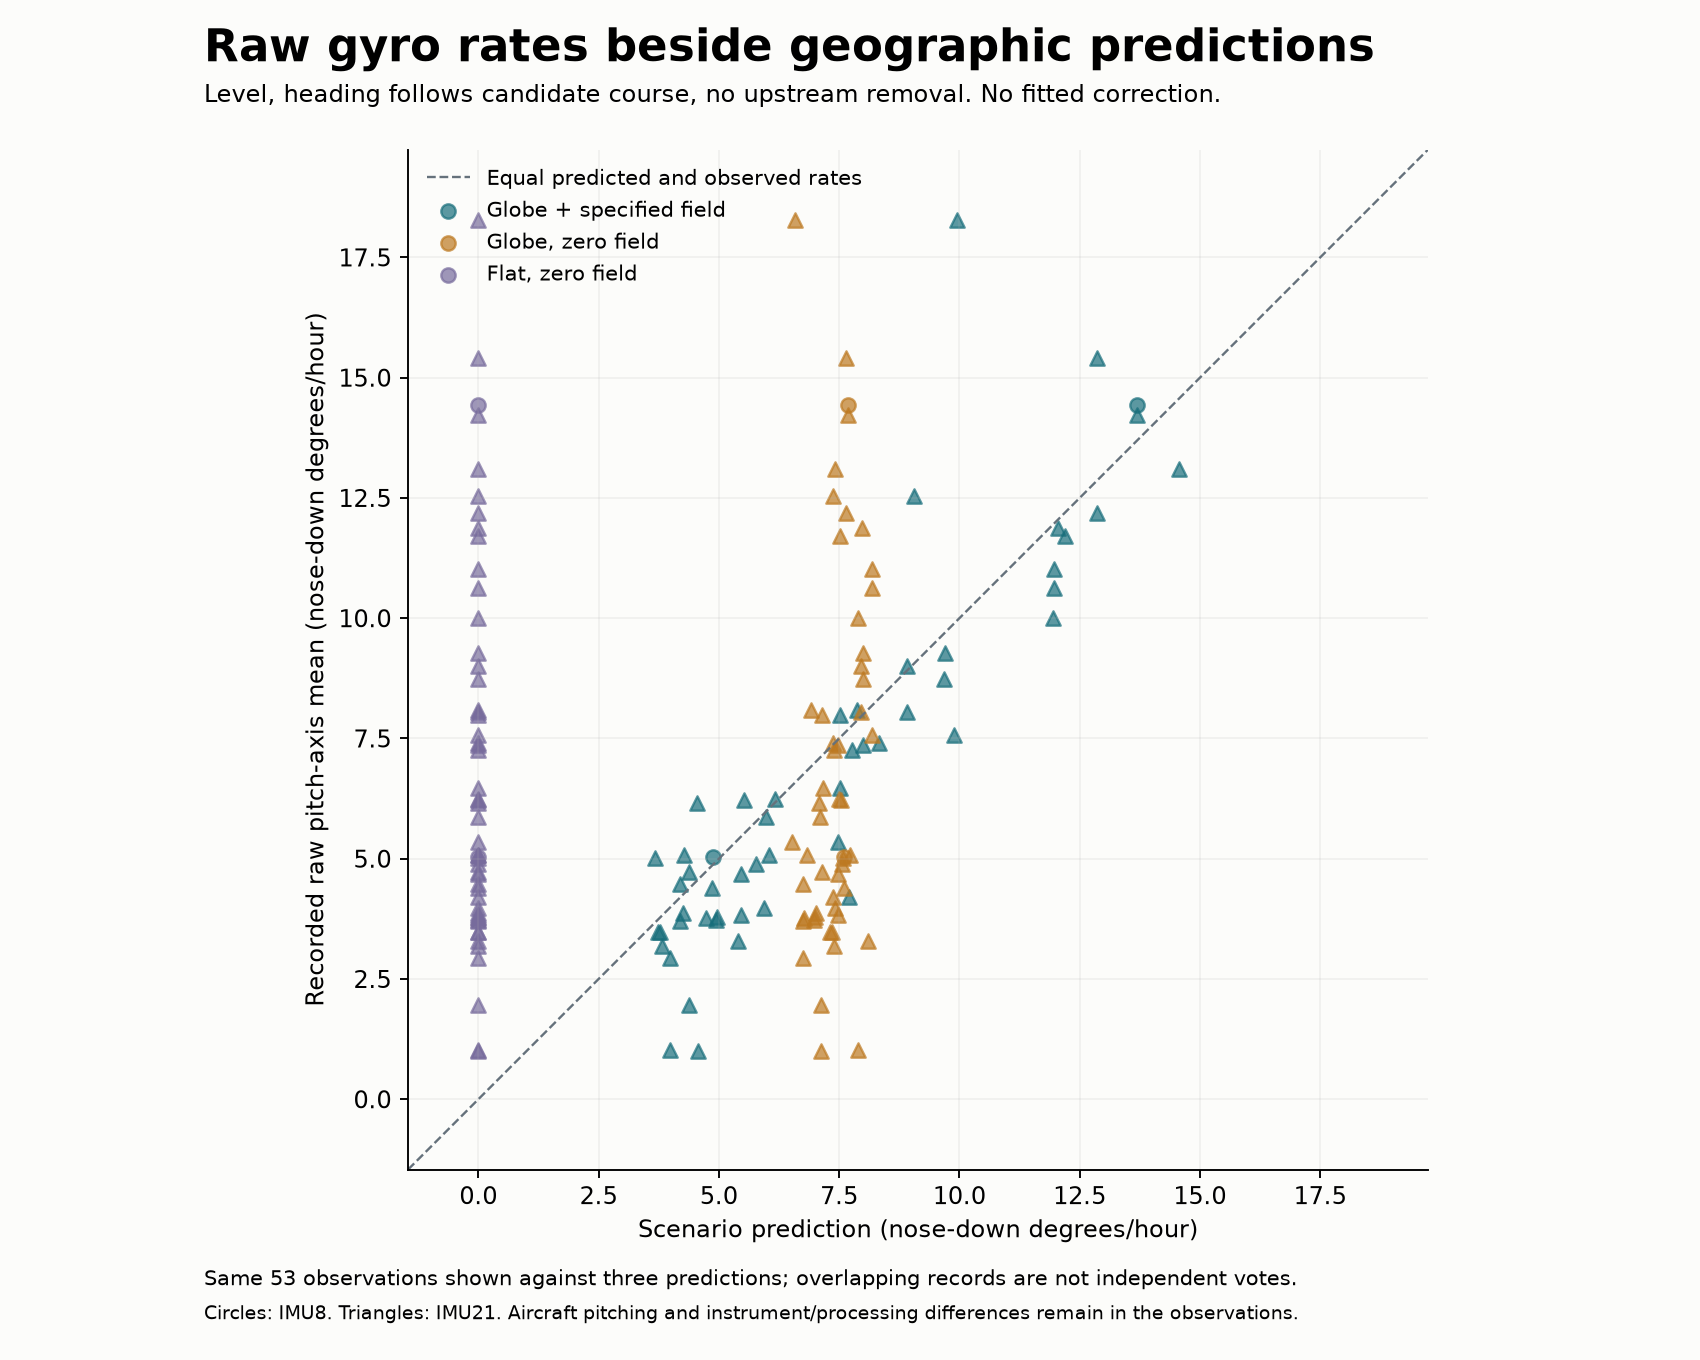
Each stretch appears three times at the same observed rate. Its horizontal position changes with the prediction. The dashed line marks equality. Circles are IMU8 records; triangles are IMU21. Positive rates mean nose-down turning.
| Declared level-flight prediction | Median absolute difference from the recorded rate |
|---|---|
| Globe plus the specified background field | 0.88 degrees/hour |
| Globe with zero background field | 2.84 degrees/hour |
| Flat disc with zero background field | 5.87 degrees/hour |
The field term changes with course and latitude. Globe transport also predicts turning as local down changes along the route. The level flat prediction has no pitch contribution from transport. The variation among the recorded rates therefore supplies a more informative comparison than their common sign alone. Some points still differ substantially from the reference prediction.
Observations and assumptions
An IMU (inertial measurement unit) records turning and specific force. This comparison uses its preserved raw gyro bins in the recorded aircraft mounting axes. Primary-receiver positions provide latitude, longitude, height and timing for the geographic predictions. They do not create the observed gyro rates. No fused Group-1 attitude or angular rate enters the prediction or subtraction.
The reference assumes level attitude, heading equal to the ground course under each candidate's coordinate metric, and no upstream field removal. Actual aircraft pitching, heading-minus-course, roll/yaw coupling, sensor corrections and mounting uncertainty remain in the difference. It is an unattributed difference, not a separately measured aircraft-motion or sensor-bias estimate. Receiver coordinates retain their documented geodetic conventions.
All 25,433 cached gyro seconds have unique matches at the receiver-interval centers; no additional bins were excluded. The underlying cache omits a few edge samples, as documented with the original raw plot. No missing measurements are filled in. Both rates and accumulated angles use identical matched support.
There are two IMU8 and 51 IMU21 stretches, grouped into 27 conservative development split groups. Those are configuration categories and grouping rules, not verified counts of independent instruments or flights. The common geographic and survey setting also limits generalization.
Sensitivity and scientific scope
Every stretch also has 243 fixed scenarios varying constant crab, roll, pitch and upstream removal. Their finite span is a scenario comparison, not a confidence interval or exhaustive aircraft-motion allowance. No best scenario is selected from the measurements. The field magnitude is specified in advance: this study neither estimates it freely nor measures a sidereal/solar difference or identifies its physical cause.
The independent 48-case basis/rotation controls passed before all 53 observed comparisons. The study finished in 8.57 seconds with zero original-file reads, native integrations or optimizer starts. All 224 published evidence artifacts pass their SHA-256 checks. A superseded pipeline's one charged technical failure and zero observed comparisons remain preserved.
Every baseline, source and group · All fixed scenarios · Frozen method · Original raw gyro plot · Roadmap.